
THE HUMAN DEBUG DECK
78-node memory array · a tarot system for IT minds. Volatile human states, translated into objective, executable syntax. Pull a node, read its stack trace, patch the running process.
Reading the manual is easy when the CPU is cool. But when your system is actively crashing—an anxiety spike, a conflict, or a severe AR projection—your prefrontal cortex physically locks you out. Your internal GUI is compromised.
>_ THE ANALOG OVERRIDETo bypass this rendering error, you must introduce external entropy. Drawing a physical node executes an active diagnostic trace. It forces your hardware to stop looping corrupted legacy scripts and translates your chaotic, 1-Billion-bit biological telemetry into a cold, executable grounding command.
[ PRINT EDITION ]
The physical edition of The Human Debug Deck — the full 78-node array plus 13 extension cards in a rigid box. Availability and shipping details are listed in the shop.
The web version below stays free — newsletter subscribers receive its draw-console access code.
Documentation is free. Meaning pages and the draw console boot with an access code — issued to newsletter subscribers at no cost.
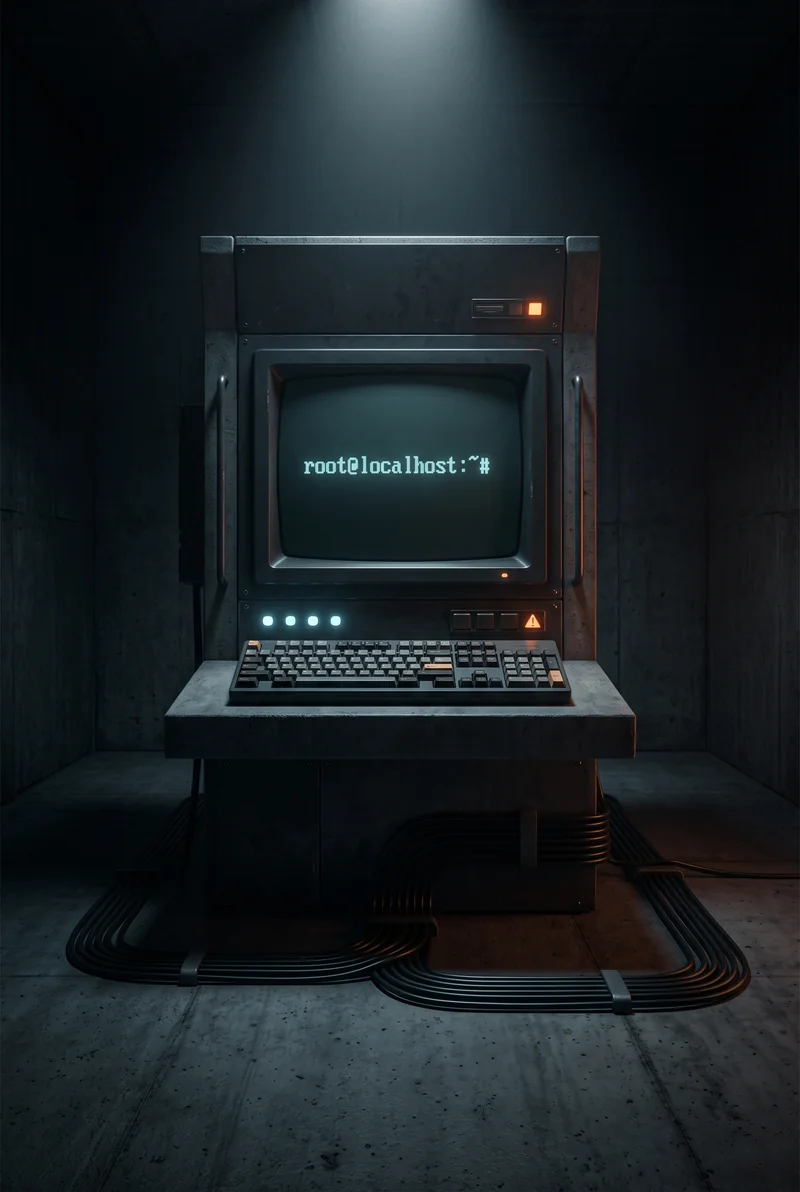
A fatal permissions error is detected. Unauthorized external nodes were previously granted write-access to your local state, crashing the active session and causing a complete loss of administrative agency.
[ READ FULL TRACE ]Full diagnostic matrices (1× to 12×) run in the draw console — access code free via newsletter.
[ BOOT DRAW CONSOLE ]>_ NODE_OF_THE_DAY
> SUDO_ADMIN
[ READ FULL TRACE ]Global broadcast — one node per calendar day (Europe/Vienna), identical for every operator. Your personal Daily Debug runs in the console.
>_ INFRASTRUCTURE TOPOLOGY
Five subsystems. Every node carries its subsystem tag and classification in the meta line.
- [CORE] KERNEL VARIABLES The deep subconscious and macro-architecture. These nodes govern massive life cycles, identity shifts, and the foundational archetypes running your master database.
- [CPU] THE COMPUTE SUBSYSTEM The execution engine. This layer governs your bandwidth, kinetic action, focus, and thermal load. It dictates how you work and spend your energy.
- [NET] THE NETWORK SUBSYSTEM The Social API. This layer governs interpersonal routing, empathy, boundaries, packet loss (miscommunications), and the execution of the stateless Love Protocol.
- [SYS] THE OS SUBSYSTEM The cognitive architecture. This layer governs your threat-modeling, cold logic, the narrating mind (PR Department), and the confrontation of harsh, unencrypted truths.
- [DISK] THE BARE_METAL SUBSYSTEM The physical chassis. This layer governs biological health, financial security, tangible assets, and the somatic baseline required to keep the server powered on.
>_ NODE CLASSIFICATION TAGS · full legend
- [HW] Hardware — physical states & resources
- [PROT] Protocol — rules, roles & interfaces
- [EXEC] Execution — actions & running processes
- [FAULT] Fault — errors, crashes & inversions
>_ EXECUTION PATH
- Browse the array — all 78 stack traces, sudo commands and inversion protocols, free and indexable.
- Read the system documentation — the SEV-1 override, the Rosetta Stone and the full runbook chapters, free like the nodes.
- Boot the draw console — from the 1-node Quick Trace to the 12-node CLUSTER SYNC AUDIT, five diagnostic matrices plus a deterministic Daily Debug.
- Order the print edition — the full 78-node array plus 13 extension cards in a rigid box, for offline, screen-free diagnostics.
- Connect to the P2P Living Node Cluster — sync your deployment logs, execute cooperative debugging, and share runtime telemetry with fellow architects in our private subnet.